Showing posts with label Edmonton. Show all posts

Friday, July 8, 2011

Edmonton Stats June 2011

Sales have dropped somewhat which could be expected for this time of year. Even with this drop the rate has maintained some gains from the dismal levels seen this time last year.


Listings dropped as expected in June.


Seasonally adjusted sales are low historically but they have been worse. This is a range similar to before the boom but above crisis levels.

The relatively low level of listings is having a stabilizing effect on the market.


The sales to new listing ration is slightly above 50%. A rate of 50% indicates a market with stable prices.

Monday, June 6, 2011

Edmonton New Construction Stats May 2011

There were 2,974 single family homes under construction in Edmonton during April. This is less than half of the amount of construction during the peak (6,528) but up from the low reached during the recession (1,764).


Looking at all types of dwelling under construction shows less of a rebound because the condo glut took longer to work off and new starts having been slower to recover. In fact there remains a surplus of completed and not absorbed units when considering all types of construction other than single family (shown in dark gray).

link

Saturday, May 7, 2011

Edmonton Stats April 2011

The REALTORS Association of Edmonton released their monthly stats here and overall they show weak sales and normal level of new listings.


The preliminary number for sales held steady with 1487 in April compared to an initial report of 1503 in March. Normally, sales are expected to increase this time of year. Preliminary sales are at scorched earth level, which is equivalent to the worst six months of the financial crisis.


Listings are rising at a normal pace for spring.


Seasonally adjusted rate of sales have been low for a year following a bounce after the financial crisis. I assumed the final number for sales will come in about 7% higher than the preliminary figure.


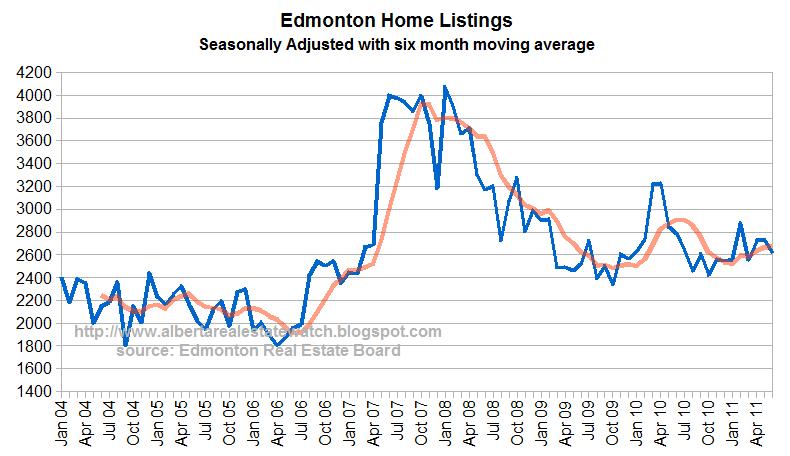
Seasonally adjusted listings have been stable since a spike last spring.


With lower sales and stable listings on a seasonally adjusted basis the sales to new listing ratio fell to 47%. A ratio lower than 50% indicates a market with downward price pressure.


Finally a historical chart of actual sales, listings and inventory.

Sunday, April 17, 2011

Edmonton New Construction Update

The number of single family homes under construction in Edmonton has decreased from 4,116 in July to 3,212 in February. Starts have fallen over 50% YOY while completions increased by 60%.


The amount of units under construction or unabsorbed for all types of residential structures has decreased for 5 consecutive months.

Friday, January 14, 2011

Edmonton New Construction Update

The number of single family homes under construction in Edmonton is declining slowly as starts have decreased. As of the most recently available monthly stats starts have fallen 30% YOY while completions increased by 90%.

When considering all types of residential structures under construction things have been holding steady now for over a year. It is interesting how activity has shifted towards SFH as the condo glut lasted longer after the boom.


link

Saturday, January 8, 2011

Edmonton Market Stats December 2010

Once again the updated sales, listing and seasonally adjusted charts for Edmonton.


Sales remain above the dismal pace of the financial crisis but below the more robust pace set during the 2nd half of 2009.


Listings are following the rate set during the 2nd hald of 2009.


On a seasonally adjusted basis home sales have recovered somewhat from earlier this year.


The spike of listings which contributed to the year over year increase in inventory has settled down.


The seasonally adjusted sales to new listing ratio has increased due to more sales and reduced listings. The rate currently stands at 57%. I would be cautious reading too much into this due to the lower volume in the winter months. However, if this ratio stays at this level into the spring market we may see YOY inventory drops and prices stabilizing. The question is how big of a listings rush will there be this spring?


The last chart shows sales, new listings and inventory over the years.

The median price of single family homes has moved down considerably since spring. Down to $336,500 from $370,000 in May, or almost 10%. These price declines are a combination of real market deterioration and seasonality as I mentioned in June.
The seasonally adjust sales to listing ratio is 42% and has been flat for three months. Expect price drops soon.

I think that some of the price measures are elevated right now due to seasonality and high level of luxury sales (see Edmonton Real Estate Blog for price stats). This works both ways as it shows prices have been rising all year (when they haven't) and will exaggerate the drops during the second half.
It comes as no surprise that the EREB was way too optimistic on their revised prediction of 19,000 sales half way through the year. I was also optimistic guessing 16,576 when the preliminary total right now stands at 16,241.

Thursday, November 4, 2010

Edmonton New Construction Sept 2010

The number of single family homes under construction in Edmonton has leveled off after over a year of increasing steadily. In April 2009 there were only 1,764 homes were under construction, this increased to 4,116 this July and as of September was 4,078.


When factoring in all types of construction it is clear that single family homes have been more popular recently. The glut of completed and unabsorbed condos* remains high but is down somewhat year over year from 1,224 to 946. *Actually dark grey in the chart below is everything except single family homes, which are mostly condos

link

Saturday, September 4, 2010

Market Update for Edmonton

Preliminary sales are closely following the scorched earth benchmark after falling significantly from last year's levels.


Listings are back to normal after spiking this spring.


The seasonally adjusted sales to new listing ratio climbed to 51% from the decrease in new listings. This has not been enough to reverse the current trend of falling prices as inventory remains high, sales remain terrible and sentiment has turned.

Thursday, August 5, 2010

Edmonton July Stats: Sales remain slow

Preliminary numbers showed a drop in sales as expected for this time of year. However that leaves us about the same as June where sales were terrible. I added the final numbers to the chart as well.

Seasonally adjusted sales are at a similar rate as the worst six months of the financial crisis. I estimated July sales to be 1378, or 6.5% higher than the preliminary number.


New listings fell as in July and inventory declined from 9,406 to 8,892. This can be expected but the decrease was more pronounced than usual for the month.


Sales to new listings ratio remains low but improved slightly due to the decrease in listings. The market conditions are beginning to show up in price with the SFH median falling to $360,000, down $10,000 from May.

Tuesday, May 4, 2010

Edmonton stats - listings remain high

New listings in Edmonton are coming on the market at a substantially higher rate than the 2nd half of 2009. Clearly many of these sellers will be unsuccessful and the market will be forced to find a new equilibrium. The question is on the path to equilibrium will there be a self reinforcing negative cycle and how long it will last. Listings will tell this story during the second half of this year.


Sales were off to a slow start this year and are now following a seasonal trend albeit at a lower level than the last half of 2009.


The seasonally adjusted sales to new listing ratio remains below 50% from which we can expect price decreases.

Looking back at historical figures listings are similar those that lead to peak inventory levels of 2007 and 2008 while sales are relatively low.

Sunday, April 18, 2010

Upward-sloping supply curve

Listings have been running higher because the price sellers think they can get is inflated. In addition to low interest rates the market improved in 2009 because sellers understood that they needed fairly substantial discounts off peak price and buyers could find better value (relatively).

It no surprise that listings have increased as asking prices have. Consider a benchmark house I have previously covered. Approximately 1700 sqft 2-story house with double attached garage and bonus room in a newer south east Edmonton community of Ellerslie. In October 2009 I did a comparison of one that was priced at $374,900. I noted that the price to rent ratio was high at 220, but with the financing available at the time the buy vs. rent was closer.


Now the least expensive house that matches the same criteria is this $410,900 1701sqft two story. In this environment people are coming out of the woodwork to sell.


There are other similar houses asking more. Asking prices in general will need to fall to move the inventory that is accumulating.