This post is another response to the Village Whisperer with respect to recent
writings on inflation. My position that the government statistics are reasonable will not go over well with those who would rather feel superior by knowing "truths" that the masses are oblivious to. Oh well.
No doubt driving around to visit friends and family you took time to fill up your gas tank.
If you live in Greater Vancouver, your jolly spirit will have been tempered by gasoline prices which have touched north of $1.20 per litre ($1.22 at some stations).
Whoa!
Gas has gone back to the highs we experienced when oil was at over $140 per barrel, whereas right now oil is at $90 per barrel. What gives?
Even better, government statistics tell us that inflation has fallen to 1.3%.
Uh-huh.
Across Canada average gasoline prices reached $1.39/litre in June 2008 while they are currently $1.10/litre.
Statistics Canada
reported inflation for November indicate a yearly increase of 2% with core inflation, which excludes more volatile components, increasing by 1.4%. The report is transparent in that it breaks apart the
individual components. For instance gasoline prices increased by 7.2% while clothing and footwear has decreased by 3.2%. I'm sure with recent gas prices they will accurately report another increase for December. In other words no conspiracy.
Bloomberg reports beef prices increased 6.2% above last November, with steak prices up 5.4% and ground beef prices up 7.4%. Pork is up 12.9%. Poultry prices (including turkey) up 3.2%.
Egg prices increased 4.7%. Dairy 3.8%. Cheese 5.4%. Ice cream and related product prices 32.1%.
Cereal and bakery product prices are down 0.3%, but rapidly rising wheat futures mean prices can only be held in check for so long.
Meanwhile coffee, sugar, and wheat are up over 35%.
From the highlighted items in the blog post it would appear the Bloomberg report contradicts the reports of low inflation. However, by reading the article it is apparent the opposite is true. With inflation statistics aggregate results are more important than cherry picked outliers. Also a closer look at the data suggests yearly volatility for specific categories. For instance dairy has increased by 3.8% but only after a decline of 6.4% the previous year. While it is true there has been increases in the selected items above overall food prices have increased very little.
In 2010, the Consumer Price Index (CPI) for all food is projected to increase 0.5 to 1.5 percent--the lowest annual food inflation rate since 1992. Food-at-home (grocery store) prices are also forecast to increase 0.5 to 1.5 percent, while food- away-from-home (restaurant) prices are forecast to increase 1 to 2 percent.
The blog entry continues with McDonalds, Walmart and China:
That's why businesses like McDonalds are already letting consumers know they plan on raising prices next year. As noted by the Wall Street Journal:
McDonalds is raising prices for the first time in over a year. There was hints of cost push inflation with commodity prices "soaring" by 2-3% per year. However, the evidence also suggests demand pull inflation with earnings up 10% and
strong sales.
Even that bastion of low prices, Wallmart, has been forced to hike prices. Inflation is raging in China and their costs are soaring. Wallmart simply cannot procur products at the same low wholesale costs.
The reference to Walmart is a survey for a single store for a single month. In China inflation is due to domestic credit expansion combined with their currency not being allowed to appreciate vs. the U.S. dollar.
Take another look at those price changes above. Which statistic do you believe... inflation at 1% or inflation at 7%?
"Four legs good. Two legs better." Couldn't have said it better myself, George.
I think the Animal Farm reference is more suitable to how those in power exploit the tea-party subjects through misinformation. This could be simply to
enrich themselves or to gain political power as Paul Krugman explains out in a recent
article.So what’s really motivating the G.O.P. attack on the Fed? Mr. Bernanke and his colleagues were clearly caught by surprise, but the budget expert Stan Collender predicted it all. Back in August, he warned Mr. Bernanke that “with Republican policy makers seeing economic hardship as the path to election glory,” they would be “opposed to any actions taken by the Federal Reserve that would make the economy better.” In short, their real fear is not that Fed actions will be harmful, it is that they might succeed.
Since the political will of any government action is evaporating, and household debt deleveraging is not complete (or even started in Canada), I think it is likely inflation will remain below the target level of 2% in 2011.
A side note to this difference of opinion regarding inflation is interesting. After an interest rate shock subsides, inflation would support real estate prices due to higher costs of labour, materials and land relative to a devalued currency. In contrast deflation is
negative for real estate in terms of nominal prices as everything depreciates. In the milder case of inflation in the 1% range, the possibility that overvaluation will be absorbed by stagnant nominal prices as real prices fall becomes unlikely.
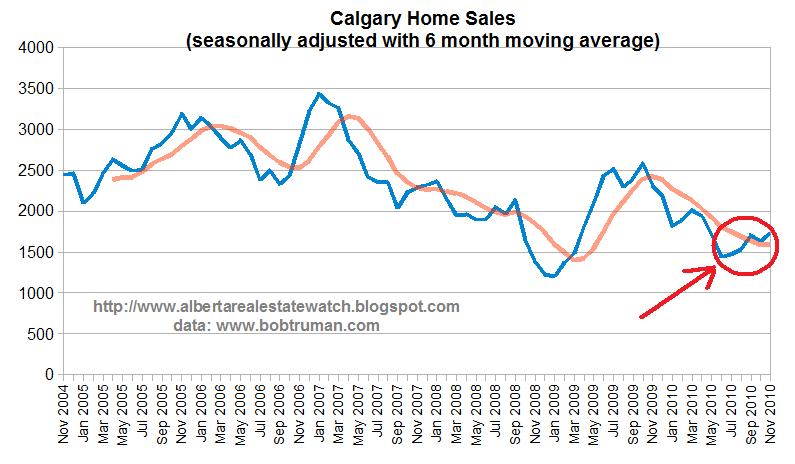
 Sales remain above the dismal pace of the financial crisis but below the more robust pace set during the 2nd half of 2009.
 Listings are following the rate set during the 2nd hald of 2009.
 On a seasonally adjusted basis home sales have recovered somewhat from earlier this year.
 The spike of listings which contributed to the year over year increase in inventory has settled down.
 The seasonally adjusted sales to new listing ratio has increased due to more sales and reduced listings. The rate currently stands at 57%. I would be cautious reading too much into this due to the lower volume in the winter months. However, if this ratio stays at this level into the spring market we may see YOY inventory drops and prices stabilizing. The question is how big of a listings rush will there be this spring?
 The last chart shows sales, new listings and inventory over the years.