So after 250 posts, almost 4 years and dozens of page views I'm calling it quits. Our family is about to double in size (twins!) and unpaid market analysis is on the bottom rung of priorities.
Some final thoughts:
While I think some of the bear blogs are overstating the downside risk to the market from factors such as demographics and CMHC underwriting I do believe that growth in mortgage credit and prices will require some level of nominal price declines. This will take time.
Right now the Alberta real estate market is in a sort of limbo. The hangover from the rapid increase in price still lingers with elevated levels of foreclosures and high debt levels. In migration and employment growth are currently positive which are offsetting this right now but global economic risks add uncertainty.
My advice would be wary of advertisers selling mortgage that are engineeringed to look cheaper than rent but aren't. Or hucksters using poor reasoning to pump a boom that isn't happening. On the other hand it is important not mindlessly cheer on those who say the job recovery is fake or that economic armagedon is around the corner. Perhaps this appeal to balance is a little condescending and I should give more credit to the majority of people who are capable of thinking critically (I am an optimist). I wish I could offer a more definitive closing but that just isn't my style.
Thanks to all who stopped by over the years and contributed to the discussion. Best of luck to all.
Friday, July 8, 2011


Edmonton Stats June 2011
Sales have dropped somewhat which could be expected for this time of year. Even with this drop the rate has maintained some gains from the dismal levels seen this time last year.

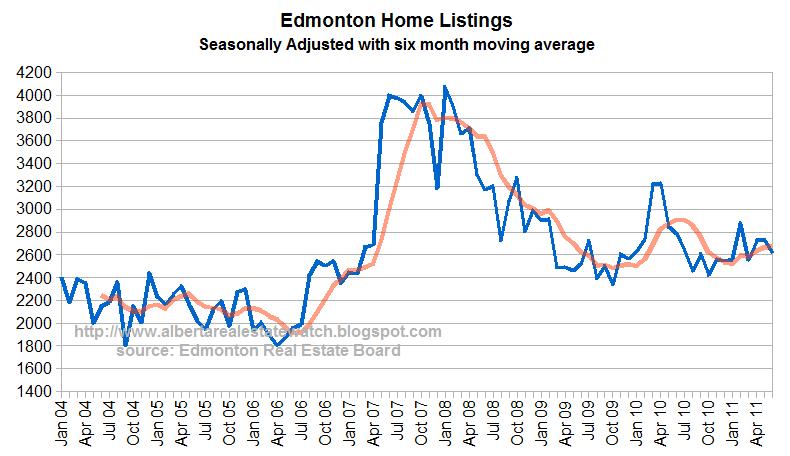
Listings dropped as expected in June.

Seasonally adjusted sales are low historically but they have been worse. This is a range similar to before the boom but above crisis levels.

The relatively low level of listings is having a stabilizing effect on the market.

The sales to new listing ration is slightly above 50%. A rate of 50% indicates a market with stable prices.


Listings dropped as expected in June.

Seasonally adjusted sales are low historically but they have been worse. This is a range similar to before the boom but above crisis levels.

The relatively low level of listings is having a stabilizing effect on the market.
The sales to new listing ration is slightly above 50%. A rate of 50% indicates a market with stable prices.

Saturday, June 18, 2011
Blast from the Past
- At the end of 2009 I had this exchange with Garth where he discussed how the Bank of Canada hiking rates would impact mortgage payments. He thought a 5-year fixed rate would be close to 7% as they move lockstep with the BoC. He had also argued there would be no more discounts available for some reason.
and that by this time a year from now BoC rate will be sitting at almost 1.6%, higher than today by 1.3%. That doesn't sound like a lot, but it puts the lowest VRM at 3.55% – which increases the monthly on a $400,000 loan by $300. A five-year mortgage would like go for close to 7%. Barn door. Horse.
#5 BearClaw on 12.16.09 at 9:47 pm
Garth,
I don’t think 5 year mortgages will be close to 7% with only a 1.3% increase in rates. 5 year mortgages are about 4% right now. An increase of 1.3% will put them at 5.3%.
There is a large spread between variable and fixed because there is some anticipation of rate increases priced in. So fixed rates may be less than 5.3% in this scenario.
Posted rate is 5.49% now at all majors. We are on the way back to 8% money in a few years. Get used to it now. — Garth
- #7 BearClaw on 12.16.09 at 9:54 pm
“The first hike will be at least a half, and probably a full load. That could raise VRMs overnight by 1% “or a little more than 44%. Ouch.”
Garth,
For a 25 year amortization it would raise the *total* payment by 12%. The interest portion would increase by 44%.
A 1% increase on a 2.25% rate is 44%. I did not mention payments. — Garth
- #10 BearClaw on 12.16.09 at 10:03 pm
"Posted rate is 5.49% now at all majors. We are on the way back to 8% money in a few years. Get used to it now.” -Garth
I think you know the difference between discounted and posted rates. But who cares? That’s not entertaining.
Kiss discounts goodbye as the BoC moves. That’s not entertaining either. — Garth
- #11 Siberta on 12.16.09 at 10:16 pm
You ain’t going to win on this site BearClaw, get used to it. You recently purchased to, if I remember correctly.
- #12 lgre on 12.16.09 at 10:21 pm
Bearclaw is learning that GT has every angle covered, dont bother trying to come from the back.
The ‘we are different’ theory is getting boring, nothing is different but everything is and will be the same…just wait for it.
Thursday, June 9, 2011
Canadian Recession and Recovery
From Stephen Gordon at Worthwhile Canadian Initiative:


The investment recovery was in two stages. In late 2009 and early 2010, expenditures were concentrated in the residential construction sector, but housing has played almost no role in the last four quarters. Happily, fixed business investment - and especially expenditures on machinery and equipment - started picking up just as the housing sector stopped contributing to growth.
See previous posts: here, here and here
Monday, June 6, 2011
Edmonton New Construction Stats May 2011
 There were 2,974 single family homes under construction in Edmonton during April. This is less than half of the amount of construction during the peak (6,528) but up from the low reached during the recession (1,764).
 Looking at all types of dwelling under construction shows less of a rebound because the condo glut took longer to work off and new starts having been slower to recover. In fact there remains a surplus of completed and not absorbed units when considering all types of construction other than single family (shown in dark gray).
 link
Saturday, June 4, 2011


Subscribe to:
Posts (Atom)