Sunday, December 26, 2010

Inflation: Believe the Government Numbers.

This post is another response to the Village Whisperer with respect to recent writings on inflation. My position that the government statistics are reasonable will not go over well with those who would rather feel superior by knowing "truths" that the masses are oblivious to. Oh well.
No doubt driving around to visit friends and family you took time to fill up your gas tank.

If you live in Greater Vancouver, your jolly spirit will have been tempered by gasoline prices which have touched north of $1.20 per litre ($1.22 at some stations).

Whoa!

Gas has gone back to the highs we experienced when oil was at over $140 per barrel, whereas right now oil is at $90 per barrel. What gives?

Even better, government statistics tell us that inflation has fallen to 1.3%.

Uh-huh.
Across Canada average gasoline prices reached $1.39/litre in June 2008 while they are currently $1.10/litre.

Statistics Canada reported inflation for November indicate a yearly increase of 2% with core inflation, which excludes more volatile components, increasing by 1.4%. The report is transparent in that it breaks apart the individual components. For instance gasoline prices increased by 7.2% while clothing and footwear has decreased by 3.2%. I'm sure with recent gas prices they will accurately report another increase for December. In other words no conspiracy.

Bloomberg reports beef prices increased 6.2% above last November, with steak prices up 5.4% and ground beef prices up 7.4%. Pork is up 12.9%. Poultry prices (including turkey) up 3.2%.

Egg prices increased 4.7%. Dairy 3.8%. Cheese 5.4%. Ice cream and related product prices 32.1%.

Cereal and bakery product prices are down 0.3%, but rapidly rising wheat futures mean prices can only be held in check for so long.

Meanwhile coffee, sugar, and wheat are up over 35%.
From the highlighted items in the blog post it would appear the Bloomberg report contradicts the reports of low inflation. However, by reading the article it is apparent the opposite is true. With inflation statistics aggregate results are more important than cherry picked outliers. Also a closer look at the data suggests yearly volatility for specific categories. For instance dairy has increased by 3.8% but only after a decline of 6.4% the previous year. While it is true there has been increases in the selected items above overall food prices have increased very little.
In 2010, the Consumer Price Index (CPI) for all food is projected to increase 0.5 to 1.5 percent--the lowest annual food inflation rate since 1992. Food-at-home (grocery store) prices are also forecast to increase 0.5 to 1.5 percent, while food- away-from-home (restaurant) prices are forecast to increase 1 to 2 percent.

The blog entry continues with McDonalds, Walmart and China:

That's why businesses like McDonalds are already letting consumers know they plan on raising prices next year. As noted by the Wall Street Journal:
  • "Timing and executing price increases can be tricky as McDonald's and other companies are caught between paying more for key materials such as meat and wheat, and keeping prices low to attract price-sensitive customers in a still-weak economy."
McDonalds is raising prices for the first time in over a year. There was hints of cost push inflation with commodity prices "soaring" by 2-3% per year. However, the evidence also suggests demand pull inflation with earnings up 10% and strong sales.
Even that bastion of low prices, Wallmart, has been forced to hike prices. Inflation is raging in China and their costs are soaring. Wallmart simply cannot procur products at the same low wholesale costs.
The reference to Walmart is a survey for a single store for a single month. In China inflation is due to domestic credit expansion combined with their currency not being allowed to appreciate vs. the U.S. dollar.
Take another look at those price changes above. Which statistic do you believe... inflation at 1% or inflation at 7%?

"Four legs good. Two legs better." Couldn't have said it better myself, George.
I think the Animal Farm reference is more suitable to how those in power exploit the tea-party subjects through misinformation. This could be simply to enrich themselves or to gain political power as Paul Krugman explains out in a recent article.
So what’s really motivating the G.O.P. attack on the Fed? Mr. Bernanke and his colleagues were clearly caught by surprise, but the budget expert Stan Collender predicted it all. Back in August, he warned Mr. Bernanke that “with Republican policy makers seeing economic hardship as the path to election glory,” they would be “opposed to any actions taken by the Federal Reserve that would make the economy better.” In short, their real fear is not that Fed actions will be harmful, it is that they might succeed.
Since the political will of any government action is evaporating, and household debt deleveraging is not complete (or even started in Canada), I think it is likely inflation will remain below the target level of 2% in 2011.

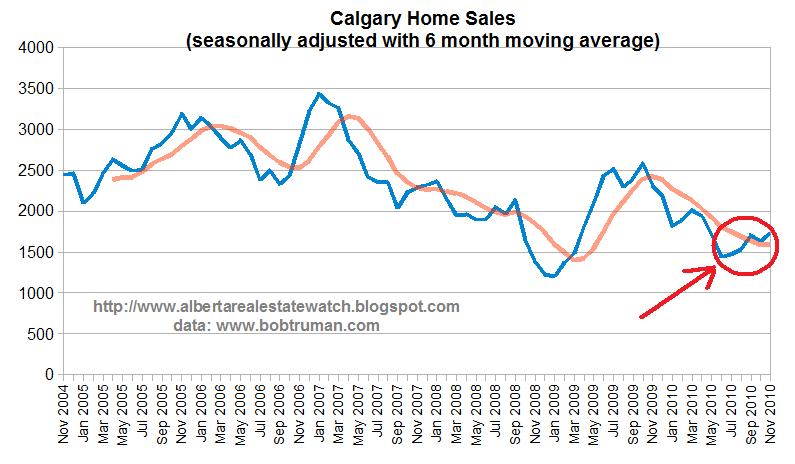
A side note to this difference of opinion regarding inflation is interesting. After an interest rate shock subsides, inflation would support real estate prices due to higher costs of labour, materials and land relative to a devalued currency. In contrast deflation is negative for real estate in terms of nominal prices as everything depreciates. In the milder case of inflation in the 1% range, the possibility that overvaluation will be absorbed by stagnant nominal prices as real prices fall becomes unlikely.

Alberta Population Report Q3 2010

The Alberta population report for the Q3 2010 was released last week here.

On a quarterly basis Alberta's population grew by 0.38% in Q3 2010.

8,267 natural growth (births - deaths)
1,155 net interprovincial migration
6,361 net international migration
-1,643 net non-permanent residents


While the Alberta population growth remains positive and higher than the Canadian average it is much slower than the boom year of 2006 due to lower inter provincial migration. International immigration and a higher natural increase has offset this somewhat. This is evident when comparing recent figures with those in 2006.

On a quarterly basis Alberta's population grew by 1.12% in Q3 2006.

6,400 natural growth (births - deaths)
16,729 net interprovincial migration
4,775 net international migration
2,795 net non permanent residence

Sunday, December 5, 2010

Subtlety from the Edmonton Sun

I had to take this screen capture from the Edmonton Sun. Looks like a mortgage broker is writing articles for them. The main theme appears to be a blind assumption of property appreciation.


Things they forgot to mention:
-Interest rate risk
-Risks associated with being a landlord
-Risk of asset depreciation combined with leverage

I'm not against people buying houses, and/or investing in real estate but this article reads like a cheesy infomercial.

Edmonton Stats November 2010


Thursday, December 2, 2010

Calgary Stats November 2010

Sales were little changed in November compared to the previous month where normally a drop would be expected.


After a spike earlier this year new listings have more closely tracked the rate equivalent to the 2nd half of 2009.

See the sales surge? Looking at a seasonally adjusted chart it's more like a modest bounce from depressed levels. Not a distressed market but not quite a robust one either.


Seasonally adjusted new listings have been holding roughly the same level as the 2nd half of 2009.


The sales to new listing ratio is stuck around 50%. This has improved from earlier this year due to lower listings and a higher seasonally adjusted sales rate.


The last chart shows sales, new listings and inventory over the last 5 years.

Raw data from Bob Truman's site
Explanation of benchmarks

Tuesday, November 30, 2010

Garth Turner Makes up Numbers

From It doesn't love us back:
(90% of new mortgages are for 35 years)
The CAAMP survey indicates this is more like 30%.


From Cowtown moment:
Exacerbating things was a recession which knocked oil prices down, increased unemployment everywhere (it’s now a chilling 10% in the GTA) and actually led to a decrease in Calgary’s population last year.
Calgary's population increased by 6,060 last year. There was a natural increase of 10,214 combined with a net migration out of 4,154.

Toronto's unemployment rate is 9.2%.


See Mike Fotiou's comment
See previous related posts here and here

Saturday, November 20, 2010

Only 910 variable payments

This has got to win an award for advertising the most ridiculous payment option for a new home.


Payments as low as $430.50. There is detail in the fine print and it's not too hard to get there:
  • Bi-weekly payments
  • 35 year amortization
  • 10% down not factoring in CMHC fees
  • And 2.5% variable rate mortgage
It's a good thing I'm not in advertising because I would probably use different wording.
After a $28,990 deposit and CMHC fees the initial payment may be as low as $430.50. The remaining nine hundred and nine payments will vary depending on the prime rate. (not including condo fees, taxes and utilities)
It is hard to grasp 910 payments so I made the illustration below. Every row represents a year of amortization between 2011 and 2045 and there are 26 payments in each. Of all these payments only the first is of the specified amount while the rest are unknown.

...or another way of looking at it

1 Jan 1, 2011 $430.50
2 Jan 15, 2011 ?
3 Jan 29, 2011 ?
4 Feb 12, 2011 ?
5 Feb 26, 2011 ?
6 Mar 12, 2011 ?
7 Mar 26, 2011 ?
8 Apr 9, 2011 ?
9 Apr 23, 2011 ?
10 May 7, 2011 ?
11 May 21, 2011 ?
12 Jun 4, 2011 ?
13 Jun 18, 2011 ?
14 Jul 2, 2011 ?
15 Jul 16, 2011 ?
16 Jul 30, 2011 ?
17 Aug 13, 2011 ?
18 Aug 27, 2011 ?
19 Sep 10, 2011 ?
20 Sep 24, 2011 ?
21 Oct 8, 2011 ?
22 Oct 22, 2011 ?
23 Nov 5, 2011 ?
24 Nov 19, 2011 ?
25 Dec 3, 2011 ?
26 Dec 17, 2011 ?
27 Dec 31, 2011 ?
28 Jan 14, 2012 ?
29 Jan 28, 2012 ?
30 Feb 11, 2012 ?
31 Feb 25, 2012 ?
32 Mar 10, 2012 ?
33 Mar 24, 2012 ?
34 Apr 7, 2012 ?
35 Apr 21, 2012 ?
36 May 5, 2012 ?
37 May 19, 2012 ?
38 Jun 2, 2012 ?
39 Jun 16, 2012 ?
40 Jun 30, 2012 ?
41 Jul 14, 2012 ?
42 Jul 28, 2012 ?
43 Aug 11, 2012 ?
44 Aug 25, 2012 ?
45 Sep 8, 2012 ?
46 Sep 22, 2012 ?
47 Oct 6, 2012 ?
48 Oct 20, 2012 ?
49 Nov 3, 2012 ?
50 Nov 17, 2012 ?
51 Dec 1, 2012 ?
52 Dec 15, 2012 ?
53 Dec 29, 2012 ?
54 Jan 12, 2013 ?
55 Jan 26, 2013 ?
56 Feb 9, 2013 ?
57 Feb 23, 2013 ?
58 Mar 9, 2013 ?
59 Mar 23, 2013 ?
60 Apr 6, 2013 ?
61 Apr 20, 2013 ?
62 May 4, 2013 ?
63 May 18, 2013 ?
64 Jun 1, 2013 ?
65 Jun 15, 2013 ?
66 Jun 29, 2013 ?
67 Jul 13, 2013 ?
68 Jul 27, 2013 ?
69 Aug 10, 2013 ?
70 Aug 24, 2013 ?
71 Sep 7, 2013 ?
72 Sep 21, 2013 ?
73 Oct 5, 2013 ?
74 Oct 19, 2013 ?
75 Nov 2, 2013 ?
76 Nov 16, 2013 ?
77 Nov 30, 2013 ?
78 Dec 14, 2013 ?
79 Dec 28, 2013 ?
80 Jan 11, 2014 ?
81 Jan 25, 2014 ?
82 Feb 8, 2014 ?
83 Feb 22, 2014 ?
84 Mar 8, 2014 ?
85 Mar 22, 2014 ?
86 Apr 5, 2014 ?
87 Apr 19, 2014 ?
88 May 3, 2014 ?
89 May 17, 2014 ?
90 May 31, 2014 ?
91 Jun 14, 2014 ?
92 Jun 28, 2014 ?
93 Jul 12, 2014 ?
94 Jul 26, 2014 ?
95 Aug 9, 2014 ?
96 Aug 23, 2014 ?
97 Sep 6, 2014 ?
98 Sep 20, 2014 ?
99 Oct 4, 2014 ?
100 Oct 18, 2014 ?
101 Nov 1, 2014 ?
102 Nov 15, 2014 ?
103 Nov 29, 2014 ?
104 Dec 13, 2014 ?
105 Dec 27, 2014 ?
106 Jan 10, 2015 ?
107 Jan 24, 2015 ?
108 Feb 7, 2015 ?
109 Feb 21, 2015 ?
110 Mar 7, 2015 ?
111 Mar 21, 2015 ?
112 Apr 4, 2015 ?
113 Apr 18, 2015 ?
114 May 2, 2015 ?
115 May 16, 2015 ?
116 May 30, 2015 ?
117 Jun 13, 2015 ?
118 Jun 27, 2015 ?
119 Jul 11, 2015 ?
120 Jul 25, 2015 ?
121 Aug 8, 2015 ?
122 Aug 22, 2015 ?
123 Sep 5, 2015 ?
124 Sep 19, 2015 ?
125 Oct 3, 2015 ?
126 Oct 17, 2015 ?
127 Oct 31, 2015 ?
128 Nov 14, 2015 ?
129 Nov 28, 2015 ?
130 Dec 12, 2015 ?
131 Dec 26, 2015 ?
132 Jan 9, 2016 ?
133 Jan 23, 2016 ?
134 Feb 6, 2016 ?
135 Feb 20, 2016 ?
136 Mar 5, 2016 ?
137 Mar 19, 2016 ?
138 Apr 2, 2016 ?
139 Apr 16, 2016 ?
140 Apr 30, 2016 ?
141 May 14, 2016 ?
142 May 28, 2016 ?
143 Jun 11, 2016 ?
144 Jun 25, 2016 ?
145 Jul 9, 2016 ?
146 Jul 23, 2016 ?
147 Aug 6, 2016 ?
148 Aug 20, 2016 ?
149 Sep 3, 2016 ?
150 Sep 17, 2016 ?
151 Oct 1, 2016 ?
152 Oct 15, 2016 ?
153 Oct 29, 2016 ?
154 Nov 12, 2016 ?
155 Nov 26, 2016 ?
156 Dec 10, 2016 ?
157 Dec 24, 2016 ?
158 Jan 7, 2017 ?
159 Jan 21, 2017 ?
160 Feb 4, 2017 ?
161 Feb 18, 2017 ?
162 Mar 4, 2017 ?
163 Mar 18, 2017 ?
164 Apr 1, 2017 ?
165 Apr 15, 2017 ?
166 Apr 29, 2017 ?
167 May 13, 2017 ?
168 May 27, 2017 ?
169 Jun 10, 2017 ?
170 Jun 24, 2017 ?
171 Jul 8, 2017 ?
172 Jul 22, 2017 ?
173 Aug 5, 2017 ?
174 Aug 19, 2017 ?
175 Sep 2, 2017 ?
176 Sep 16, 2017 ?
177 Sep 30, 2017 ?
178 Oct 14, 2017 ?
179 Oct 28, 2017 ?
180 Nov 11, 2017 ?
181 Nov 25, 2017 ?
182 Dec 9, 2017 ?
183 Dec 23, 2017 ?
184 Jan 6, 2018 ?
185 Jan 20, 2018 ?
186 Feb 3, 2018 ?
187 Feb 17, 2018 ?
188 Mar 3, 2018 ?
189 Mar 17, 2018 ?
190 Mar 31, 2018 ?
191 Apr 14, 2018 ?
192 Apr 28, 2018 ?
193 May 12, 2018 ?
194 May 26, 2018 ?
195 Jun 9, 2018 ?
196 Jun 23, 2018 ?
197 Jul 7, 2018 ?
198 Jul 21, 2018 ?
199 Aug 4, 2018 ?
200 Aug 18, 2018 ?
201 Sep 1, 2018 ?
202 Sep 15, 2018 ?
203 Sep 29, 2018 ?
204 Oct 13, 2018 ?
205 Oct 27, 2018 ?
206 Nov 10, 2018 ?
207 Nov 24, 2018 ?
208 Dec 8, 2018 ?
209 Dec 22, 2018 ?
210 Jan 5, 2019 ?
211 Jan 19, 2019 ?
212 Feb 2, 2019 ?
213 Feb 16, 2019 ?
214 Mar 2, 2019 ?
215 Mar 16, 2019 ?
216 Mar 30, 2019 ?
217 Apr 13, 2019 ?
218 Apr 27, 2019 ?
219 May 11, 2019 ?
220 May 25, 2019 ?
221 Jun 8, 2019 ?
222 Jun 22, 2019 ?
223 Jul 6, 2019 ?
224 Jul 20, 2019 ?
225 Aug 3, 2019 ?
226 Aug 17, 2019 ?
227 Aug 31, 2019 ?
228 Sep 14, 2019 ?
229 Sep 28, 2019 ?
230 Oct 12, 2019 ?
231 Oct 26, 2019 ?
232 Nov 9, 2019 ?
233 Nov 23, 2019 ?
234 Dec 7, 2019 ?
235 Dec 21, 2019 ?
236 Jan 4, 2020 ?
237 Jan 18, 2020 ?
238 Feb 1, 2020 ?
239 Feb 15, 2020 ?
240 Feb 29, 2020 ?
241 Mar 14, 2020 ?
242 Mar 28, 2020 ?
243 Apr 11, 2020 ?
244 Apr 25, 2020 ?
245 May 9, 2020 ?
246 May 23, 2020 ?
247 Jun 6, 2020 ?
248 Jun 20, 2020 ?
249 Jul 4, 2020 ?
250 Jul 18, 2020 ?
251 Aug 1, 2020 ?
252 Aug 15, 2020 ?
253 Aug 29, 2020 ?
254 Sep 12, 2020 ?
255 Sep 26, 2020 ?
256 Oct 10, 2020 ?
257 Oct 24, 2020 ?
258 Nov 7, 2020 ?
259 Nov 21, 2020 ?
260 Dec 5, 2020 ?
261 Dec 19, 2020 ?
262 Jan 2, 2021 ?
263 Jan 16, 2021 ?
264 Jan 30, 2021 ?
265 Feb 13, 2021 ?
266 Feb 27, 2021 ?
267 Mar 13, 2021 ?
268 Mar 27, 2021 ?
269 Apr 10, 2021 ?
270 Apr 24, 2021 ?
271 May 8, 2021 ?
272 May 22, 2021 ?
273 Jun 5, 2021 ?
274 Jun 19, 2021 ?
275 Jul 3, 2021 ?
276 Jul 17, 2021 ?
277 Jul 31, 2021 ?
278 Aug 14, 2021 ?
279 Aug 28, 2021 ?
280 Sep 11, 2021 ?
281 Sep 25, 2021 ?
282 Oct 9, 2021 ?
283 Oct 23, 2021 ?
284 Nov 6, 2021 ?
285 Nov 20, 2021 ?
286 Dec 4, 2021 ?
287 Dec 18, 2021 ?
288 Jan 1, 2022 ?
289 Jan 15, 2022 ?
290 Jan 29, 2022 ?
291 Feb 12, 2022 ?
292 Feb 26, 2022 ?
293 Mar 12, 2022 ?
294 Mar 26, 2022 ?
295 Apr 9, 2022 ?
296 Apr 23, 2022 ?
297 May 7, 2022 ?
298 May 21, 2022 ?
299 Jun 4, 2022 ?
300 Jun 18, 2022 ?
301 Jul 2, 2022 ?
302 Jul 16, 2022 ?
303 Jul 30, 2022 ?
304 Aug 13, 2022 ?
305 Aug 27, 2022 ?
306 Sep 10, 2022 ?
307 Sep 24, 2022 ?
308 Oct 8, 2022 ?
309 Oct 22, 2022 ?
310 Nov 5, 2022 ?
311 Nov 19, 2022 ?
312 Dec 3, 2022 ?
313 Dec 17, 2022 ?
314 Dec 31, 2022 ?
315 Jan 14, 2023 ?
316 Jan 28, 2023 ?
317 Feb 11, 2023 ?
318 Feb 25, 2023 ?
319 Mar 11, 2023 ?
320 Mar 25, 2023 ?
321 Apr 8, 2023 ?
322 Apr 22, 2023 ?
323 May 6, 2023 ?
324 May 20, 2023 ?
325 Jun 3, 2023 ?
326 Jun 17, 2023 ?
327 Jul 1, 2023 ?
328 Jul 15, 2023 ?
329 Jul 29, 2023 ?
330 Aug 12, 2023 ?
331 Aug 26, 2023 ?
332 Sep 9, 2023 ?
333 Sep 23, 2023 ?
334 Oct 7, 2023 ?
335 Oct 21, 2023 ?
336 Nov 4, 2023 ?
337 Nov 18, 2023 ?
338 Dec 2, 2023 ?
339 Dec 16, 2023 ?
340 Dec 30, 2023 ?
341 Jan 13, 2024 ?
342 Jan 27, 2024 ?
343 Feb 10, 2024 ?
344 Feb 24, 2024 ?
345 Mar 9, 2024 ?
346 Mar 23, 2024 ?
347 Apr 6, 2024 ?
348 Apr 20, 2024 ?
349 May 4, 2024 ?
350 May 18, 2024 ?
351 Jun 1, 2024 ?
352 Jun 15, 2024 ?
353 Jun 29, 2024 ?
354 Jul 13, 2024 ?
355 Jul 27, 2024 ?
356 Aug 10, 2024 ?
357 Aug 24, 2024 ?
358 Sep 7, 2024 ?
359 Sep 21, 2024 ?
360 Oct 5, 2024 ?
361 Oct 19, 2024 ?
362 Nov 2, 2024 ?
363 Nov 16, 2024 ?
364 Nov 30, 2024 ?
365 Dec 14, 2024 ?
366 Dec 28, 2024 ?
367 Jan 11, 2025 ?
368 Jan 25, 2025 ?
369 Feb 8, 2025 ?
370 Feb 22, 2025 ?
371 Mar 8, 2025 ?
372 Mar 22, 2025 ?
373 Apr 5, 2025 ?
374 Apr 19, 2025 ?
375 May 3, 2025 ?
376 May 17, 2025 ?
377 May 31, 2025 ?
378 Jun 14, 2025 ?
379 Jun 28, 2025 ?
380 Jul 12, 2025 ?
381 Jul 26, 2025 ?
382 Aug 9, 2025 ?
383 Aug 23, 2025 ?
384 Sep 6, 2025 ?
385 Sep 20, 2025 ?
386 Oct 4, 2025 ?
387 Oct 18, 2025 ?
388 Nov 1, 2025 ?
389 Nov 15, 2025 ?
390 Nov 29, 2025 ?
391 Dec 13, 2025 ?
392 Dec 27, 2025 ?
393 Jan 10, 2026 ?
394 Jan 24, 2026 ?
395 Feb 7, 2026 ?
396 Feb 21, 2026 ?
397 Mar 7, 2026 ?
398 Mar 21, 2026 ?
399 Apr 4, 2026 ?
400 Apr 18, 2026 ?
401 May 2, 2026 ?
402 May 16, 2026 ?
403 May 30, 2026 ?
404 Jun 13, 2026 ?
405 Jun 27, 2026 ?
406 Jul 11, 2026 ?
407 Jul 25, 2026 ?
408 Aug 8, 2026 ?
409 Aug 22, 2026 ?
410 Sep 5, 2026 ?
411 Sep 19, 2026 ?
412 Oct 3, 2026 ?
413 Oct 17, 2026 ?
414 Oct 31, 2026 ?
415 Nov 14, 2026 ?
416 Nov 28, 2026 ?
417 Dec 12, 2026 ?
418 Dec 26, 2026 ?
419 Jan 9, 2027 ?
420 Jan 23, 2027 ?
421 Feb 6, 2027 ?
422 Feb 20, 2027 ?
423 Mar 6, 2027 ?
424 Mar 20, 2027 ?
425 Apr 3, 2027 ?
426 Apr 17, 2027 ?
427 May 1, 2027 ?
428 May 15, 2027 ?
429 May 29, 2027 ?
430 Jun 12, 2027 ?
431 Jun 26, 2027 ?
432 Jul 10, 2027 ?
433 Jul 24, 2027 ?
434 Aug 7, 2027 ?
435 Aug 21, 2027 ?
436 Sep 4, 2027 ?
437 Sep 18, 2027 ?
438 Oct 2, 2027 ?
439 Oct 16, 2027 ?
440 Oct 30, 2027 ?
441 Nov 13, 2027 ?
442 Nov 27, 2027 ?
443 Dec 11, 2027 ?
444 Dec 25, 2027 ?
445 Jan 8, 2028 ?
446 Jan 22, 2028 ?
447 Feb 5, 2028 ?
448 Feb 19, 2028 ?
449 Mar 4, 2028 ?
450 Mar 18, 2028 ?
451 Apr 1, 2028 ?
452 Apr 15, 2028 ?
453 Apr 29, 2028 ?
454 May 13, 2028 ?
455 May 27, 2028 ?
456 Jun 10, 2028 ?
457 Jun 24, 2028 ?
458 Jul 8, 2028 ?
459 Jul 22, 2028 ?
460 Aug 5, 2028 ?
461 Aug 19, 2028 ?
462 Sep 2, 2028 ?
463 Sep 16, 2028 ?
464 Sep 30, 2028 ?
465 Oct 14, 2028 ?
466 Oct 28, 2028 ?
467 Nov 11, 2028 ?
468 Nov 25, 2028 ?
469 Dec 9, 2028 ?
470 Dec 23, 2028 ?
471 Jan 6, 2029 ?
472 Jan 20, 2029 ?
473 Feb 3, 2029 ?
474 Feb 17, 2029 ?
475 Mar 3, 2029 ?
476 Mar 17, 2029 ?
477 Mar 31, 2029 ?
478 Apr 14, 2029 ?
479 Apr 28, 2029 ?
480 May 12, 2029 ?
481 May 26, 2029 ?
482 Jun 9, 2029 ?
483 Jun 23, 2029 ?
484 Jul 7, 2029 ?
485 Jul 21, 2029 ?
486 Aug 4, 2029 ?
487 Aug 18, 2029 ?
488 Sep 1, 2029 ?
489 Sep 15, 2029 ?
490 Sep 29, 2029 ?
491 Oct 13, 2029 ?
492 Oct 27, 2029 ?
493 Nov 10, 2029 ?
494 Nov 24, 2029 ?
495 Dec 8, 2029 ?
496 Dec 22, 2029 ?
497 Jan 5, 2030 ?
498 Jan 19, 2030 ?
499 Feb 2, 2030 ?
500 Feb 16, 2030 ?
501 Mar 2, 2030 ?
502 Mar 16, 2030 ?
503 Mar 30, 2030 ?
504 Apr 13, 2030 ?
505 Apr 27, 2030 ?
506 May 11, 2030 ?
507 May 25, 2030 ?
508 Jun 8, 2030 ?
509 Jun 22, 2030 ?
510 Jul 6, 2030 ?
511 Jul 20, 2030 ?
512 Aug 3, 2030 ?
513 Aug 17, 2030 ?
514 Aug 31, 2030 ?
515 Sep 14, 2030 ?
516 Sep 28, 2030 ?
517 Oct 12, 2030 ?
518 Oct 26, 2030 ?
519 Nov 9, 2030 ?
520 Nov 23, 2030 ?
521 Dec 7, 2030 ?
522 Dec 21, 2030 ?
523 Jan 4, 2031 ?
524 Jan 18, 2031 ?
525 Feb 1, 2031 ?
526 Feb 15, 2031 ?
527 Mar 1, 2031 ?
528 Mar 15, 2031 ?
529 Mar 29, 2031 ?
530 Apr 12, 2031 ?
531 Apr 26, 2031 ?
532 May 10, 2031 ?
533 May 24, 2031 ?
534 Jun 7, 2031 ?
535 Jun 21, 2031 ?
536 Jul 5, 2031 ?
537 Jul 19, 2031 ?
538 Aug 2, 2031 ?
539 Aug 16, 2031 ?
540 Aug 30, 2031 ?
541 Sep 13, 2031 ?
542 Sep 27, 2031 ?
543 Oct 11, 2031 ?
544 Oct 25, 2031 ?
545 Nov 8, 2031 ?
546 Nov 22, 2031 ?
547 Dec 6, 2031 ?
548 Dec 20, 2031 ?
549 Jan 3, 2032 ?
550 Jan 17, 2032 ?
551 Jan 31, 2032 ?
552 Feb 14, 2032 ?
553 Feb 28, 2032 ?
554 Mar 13, 2032 ?
555 Mar 27, 2032 ?
556 Apr 10, 2032 ?
557 Apr 24, 2032 ?
558 May 8, 2032 ?
559 May 22, 2032 ?
560 Jun 5, 2032 ?
561 Jun 19, 2032 ?
562 Jul 3, 2032 ?
563 Jul 17, 2032 ?
564 Jul 31, 2032 ?
565 Aug 14, 2032 ?
566 Aug 28, 2032 ?
567 Sep 11, 2032 ?
568 Sep 25, 2032 ?
569 Oct 9, 2032 ?
570 Oct 23, 2032 ?
571 Nov 6, 2032 ?
572 Nov 20, 2032 ?
573 Dec 4, 2032 ?
574 Dec 18, 2032 ?
575 Jan 1, 2033 ?
576 Jan 15, 2033 ?
577 Jan 29, 2033 ?
578 Feb 12, 2033 ?
579 Feb 26, 2033 ?
580 Mar 12, 2033 ?
581 Mar 26, 2033 ?
582 Apr 9, 2033 ?
583 Apr 23, 2033 ?
584 May 7, 2033 ?
585 May 21, 2033 ?
586 Jun 4, 2033 ?
587 Jun 18, 2033 ?
588 Jul 2, 2033 ?
589 Jul 16, 2033 ?
590 Jul 30, 2033 ?
591 Aug 13, 2033 ?
592 Aug 27, 2033 ?
593 Sep 10, 2033 ?
594 Sep 24, 2033 ?
595 Oct 8, 2033 ?
596 Oct 22, 2033 ?
597 Nov 5, 2033 ?
598 Nov 19, 2033 ?
599 Dec 3, 2033 ?
600 Dec 17, 2033 ?
601 Dec 31, 2033 ?
602 Jan 14, 2034 ?
603 Jan 28, 2034 ?
604 Feb 11, 2034 ?
605 Feb 25, 2034 ?
606 Mar 11, 2034 ?
607 Mar 25, 2034 ?
608 Apr 8, 2034 ?
609 Apr 22, 2034 ?
610 May 6, 2034 ?
611 May 20, 2034 ?
612 Jun 3, 2034 ?
613 Jun 17, 2034 ?
614 Jul 1, 2034 ?
615 Jul 15, 2034 ?
616 Jul 29, 2034 ?
617 Aug 12, 2034 ?
618 Aug 26, 2034 ?
619 Sep 9, 2034 ?
620 Sep 23, 2034 ?
621 Oct 7, 2034 ?
622 Oct 21, 2034 ?
623 Nov 4, 2034 ?
624 Nov 18, 2034 ?
625 Dec 2, 2034 ?
626 Dec 16, 2034 ?
627 Dec 30, 2034 ?
628 Jan 13, 2035 ?
629 Jan 27, 2035 ?
630 Feb 10, 2035 ?
631 Feb 24, 2035 ?
632 Mar 10, 2035 ?
633 Mar 24, 2035 ?
634 Apr 7, 2035 ?
635 Apr 21, 2035 ?
636 May 5, 2035 ?
637 May 19, 2035 ?
638 Jun 2, 2035 ?
639 Jun 16, 2035 ?
640 Jun 30, 2035 ?
641 Jul 14, 2035 ?
642 Jul 28, 2035 ?
643 Aug 11, 2035 ?
644 Aug 25, 2035 ?
645 Sep 8, 2035 ?
646 Sep 22, 2035 ?
647 Oct 6, 2035 ?
648 Oct 20, 2035 ?
649 Nov 3, 2035 ?
650 Nov 17, 2035 ?
651 Dec 1, 2035 ?
652 Dec 15, 2035 ?
653 Dec 29, 2035 ?
654 Jan 12, 2036 ?
655 Jan 26, 2036 ?
656 Feb 9, 2036 ?
657 Feb 23, 2036 ?
658 Mar 8, 2036 ?
659 Mar 22, 2036 ?
660 Apr 5, 2036 ?
661 Apr 19, 2036 ?
662 May 3, 2036 ?
663 May 17, 2036 ?
664 May 31, 2036 ?
665 Jun 14, 2036 ?
666 Jun 28, 2036 ?
667 Jul 12, 2036 ?
668 Jul 26, 2036 ?
669 Aug 9, 2036 ?
670 Aug 23, 2036 ?
671 Sep 6, 2036 ?
672 Sep 20, 2036 ?
673 Oct 4, 2036 ?
674 Oct 18, 2036 ?
675 Nov 1, 2036 ?
676 Nov 15, 2036 ?
677 Nov 29, 2036 ?
678 Dec 13, 2036 ?
679 Dec 27, 2036 ?
680 Jan 10, 2037 ?
681 Jan 24, 2037 ?
682 Feb 7, 2037 ?
683 Feb 21, 2037 ?
684 Mar 7, 2037 ?
685 Mar 21, 2037 ?
686 Apr 4, 2037 ?
687 Apr 18, 2037 ?
688 May 2, 2037 ?
689 May 16, 2037 ?
690 May 30, 2037 ?
691 Jun 13, 2037 ?
692 Jun 27, 2037 ?
693 Jul 11, 2037 ?
694 Jul 25, 2037 ?
695 Aug 8, 2037 ?
696 Aug 22, 2037 ?
697 Sep 5, 2037 ?
698 Sep 19, 2037 ?
699 Oct 3, 2037 ?
700 Oct 17, 2037 ?
701 Oct 31, 2037 ?
702 Nov 14, 2037 ?
703 Nov 28, 2037 ?
704 Dec 12, 2037 ?
705 Dec 26, 2037 ?
706 Jan 9, 2038 ?
707 Jan 23, 2038 ?
708 Feb 6, 2038 ?
709 Feb 20, 2038 ?
710 Mar 6, 2038 ?
711 Mar 20, 2038 ?
712 Apr 3, 2038 ?
713 Apr 17, 2038 ?
714 May 1, 2038 ?
715 May 15, 2038 ?
716 May 29, 2038 ?
717 Jun 12, 2038 ?
718 Jun 26, 2038 ?
719 Jul 10, 2038 ?
720 Jul 24, 2038 ?
721 Aug 7, 2038 ?
722 Aug 21, 2038 ?
723 Sep 4, 2038 ?
724 Sep 18, 2038 ?
725 Oct 2, 2038 ?
726 Oct 16, 2038 ?
727 Oct 30, 2038 ?
728 Nov 13, 2038 ?
729 Nov 27, 2038 ?
730 Dec 11, 2038 ?
731 Dec 25, 2038 ?
732 Jan 8, 2039 ?
733 Jan 22, 2039 ?
734 Feb 5, 2039 ?
735 Feb 19, 2039 ?
736 Mar 5, 2039 ?
737 Mar 19, 2039 ?
738 Apr 2, 2039 ?
739 Apr 16, 2039 ?
740 Apr 30, 2039 ?
741 May 14, 2039 ?
742 May 28, 2039 ?
743 Jun 11, 2039 ?
744 Jun 25, 2039 ?
745 Jul 9, 2039 ?
746 Jul 23, 2039 ?
747 Aug 6, 2039 ?
748 Aug 20, 2039 ?
749 Sep 3, 2039 ?
750 Sep 17, 2039 ?
751 Oct 1, 2039 ?
752 Oct 15, 2039 ?
753 Oct 29, 2039 ?
754 Nov 12, 2039 ?
755 Nov 26, 2039 ?
756 Dec 10, 2039 ?
757 Dec 24, 2039 ?
758 Jan 7, 2040 ?
759 Jan 21, 2040 ?
760 Feb 4, 2040 ?
761 Feb 18, 2040 ?
762 Mar 3, 2040 ?
763 Mar 17, 2040 ?
764 Mar 31, 2040 ?
765 Apr 14, 2040 ?
766 Apr 28, 2040 ?
767 May 12, 2040 ?
768 May 26, 2040 ?
769 Jun 9, 2040 ?
770 Jun 23, 2040 ?
771 Jul 7, 2040 ?
772 Jul 21, 2040 ?
773 Aug 4, 2040 ?
774 Aug 18, 2040 ?
775 Sep 1, 2040 ?
776 Sep 15, 2040 ?
777 Sep 29, 2040 ?
778 Oct 13, 2040 ?
779 Oct 27, 2040 ?
780 Nov 10, 2040 ?
781 Nov 24, 2040 ?
782 Dec 8, 2040 ?
783 Dec 22, 2040 ?
784 Jan 5, 2041 ?
785 Jan 19, 2041 ?
786 Feb 2, 2041 ?
787 Feb 16, 2041 ?
788 Mar 2, 2041 ?
789 Mar 16, 2041 ?
790 Mar 30, 2041 ?
791 Apr 13, 2041 ?
792 Apr 27, 2041 ?
793 May 11, 2041 ?
794 May 25, 2041 ?
795 Jun 8, 2041 ?
796 Jun 22, 2041 ?
797 Jul 6, 2041 ?
798 Jul 20, 2041 ?
799 Aug 3, 2041 ?
800 Aug 17, 2041 ?
801 Aug 31, 2041 ?
802 Sep 14, 2041 ?
803 Sep 28, 2041 ?
804 Oct 12, 2041 ?
805 Oct 26, 2041 ?
806 Nov 9, 2041 ?
807 Nov 23, 2041 ?
808 Dec 7, 2041 ?
809 Dec 21, 2041 ?
810 Jan 4, 2042 ?
811 Jan 18, 2042 ?
812 Feb 1, 2042 ?
813 Feb 15, 2042 ?
814 Mar 1, 2042 ?
815 Mar 15, 2042 ?
816 Mar 29, 2042 ?
817 Apr 12, 2042 ?
818 Apr 26, 2042 ?
819 May 10, 2042 ?
820 May 24, 2042 ?
821 Jun 7, 2042 ?
822 Jun 21, 2042 ?
823 Jul 5, 2042 ?
824 Jul 19, 2042 ?
825 Aug 2, 2042 ?
826 Aug 16, 2042 ?
827 Aug 30, 2042 ?
828 Sep 13, 2042 ?
829 Sep 27, 2042 ?
830 Oct 11, 2042 ?
831 Oct 25, 2042 ?
832 Nov 8, 2042 ?
833 Nov 22, 2042 ?
834 Dec 6, 2042 ?
835 Dec 20, 2042 ?
836 Jan 3, 2043 ?
837 Jan 17, 2043 ?
838 Jan 31, 2043 ?
839 Feb 14, 2043 ?
840 Feb 28, 2043 ?
841 Mar 14, 2043 ?
842 Mar 28, 2043 ?
843 Apr 11, 2043 ?
844 Apr 25, 2043 ?
845 May 9, 2043 ?
846 May 23, 2043 ?
847 Jun 6, 2043 ?
848 Jun 20, 2043 ?
849 Jul 4, 2043 ?
850 Jul 18, 2043 ?
851 Aug 1, 2043 ?
852 Aug 15, 2043 ?
853 Aug 29, 2043 ?
854 Sep 12, 2043 ?
855 Sep 26, 2043 ?
856 Oct 10, 2043 ?
857 Oct 24, 2043 ?
858 Nov 7, 2043 ?
859 Nov 21, 2043 ?
860 Dec 5, 2043 ?
861 Dec 19, 2043 ?
862 Jan 2, 2044 ?
863 Jan 16, 2044 ?
864 Jan 30, 2044 ?
865 Feb 13, 2044 ?
866 Feb 27, 2044 ?
867 Mar 12, 2044 ?
868 Mar 26, 2044 ?
869 Apr 9, 2044 ?
870 Apr 23, 2044 ?
871 May 7, 2044 ?
872 May 21, 2044 ?
873 Jun 4, 2044 ?
874 Jun 18, 2044 ?
875 Jul 2, 2044 ?
876 Jul 16, 2044 ?
877 Jul 30, 2044 ?
878 Aug 13, 2044 ?
879 Aug 27, 2044 ?
880 Sep 10, 2044 ?
881 Sep 24, 2044 ?
882 Oct 8, 2044 ?
883 Oct 22, 2044 ?
884 Nov 5, 2044 ?
885 Nov 19, 2044 ?
886 Dec 3, 2044 ?
887 Dec 17, 2044 ?
888 Dec 31, 2044 ?
889 Jan 14, 2045 ?
890 Jan 28, 2045 ?
891 Feb 11, 2045 ?
892 Feb 25, 2045 ?
893 Mar 11, 2045 ?
894 Mar 25, 2045 ?
895 Apr 8, 2045 ?
896 Apr 22, 2045 ?
897 May 6, 2045 ?
898 May 20, 2045 ?
899 Jun 3, 2045 ?
900 Jun 17, 2045 ?
901 Jul 1, 2045 ?
902 Jul 15, 2045 ?
903 Jul 29, 2045 ?
904 Aug 12, 2045 ?
905 Aug 26, 2045 ?
906 Sep 9, 2045 ?
907 Sep 23, 2045 ?
908 Oct 7, 2045 ?
909 Oct 21, 2045 ?
910 Nov 4, 2045 ?

Sunday, November 14, 2010

Canadian Demographics and Housing

In the past I have covered some topics on housing in more depth to show a more complex and less dire reality than what some others are portraying.

One example is where I showed Garth Turner's model of a typical Canadian home buyer as exaggerated.

Another where I point out some inaccuracy regarding the systematic risk of the CMHC. (here and here)

In this post I will look at demographics and housing with this chart from the Alberta Bubble Blog as a starting point.


The conclusion is pretty clear. An aging population will lead to lower economic activity and lower demand for housing. There are a couple of details to indicate a less severe impact than implied in this graphic.

First, look at how top heavy the age distribution of the chart. It's because lower birth rates as compared to the baby boom.

But there is more to the story. At the peak in 1960 there were 479,000 births while this chart shows 540,000 people at the peak age range of 45 (in 2006). Immigration has had a role to play here otherwise this age group would have decreased. Consider the components of population growth in this chart from Statistics Canada.


Since immigration has made up a portion of population growth the pyramid will be skewed upwards. The portion of immigrants among the newborns only includes those who come to Canada within that year. In contrast those age 30 include immigrants who have come to Canada over the last 30 years at different ages.

The lower numbers represented among 0-15 age group compared to 16-30 years has more do do with immigration than declining birth rates. That is why I disagree with observation "D" in the chart "2011 to 2026 will witness a sharp decrease in the 20 - 35 year old cohort". Statistics Canada recently projected this age range will increase from 7.16 million in 2011 to 7.27 million in 2026. This was using their medium growth assumptions which I found to be totally reasonable.


I also disagree that demographics will necessarily result in an absolute drop in aggregate demand (housing or otherwise). It is true boomers represent the largest demographic and they are currently in their years of peak demand. This may be offset by a population that is still growing due to longer life expectancies, slightly higher birth rates and immigration.


One graphic used on the chart is the shift in housing demand over the next 15 years. It shows boomers will go from living alone in a 1800 sq ft single family home to assisted living space of 500 sq ft 15 years later. This definitely does not represent the group as a whole. For an alternative example consider 50 year old boomer parents with children in their late teens. They may have a house which is too big for them in 20-30 years when they require assisted living but their children will have formed households of their own long before then.

What else is not mentioned, but included in statistics Canada's current projections is an increase in the birth rate. Over the past year there were 381,000 births in Canada, compared to 338,000 in 2006. Surprisingly, this is only 20% fewer in absolute terms as the peak of the baby boom.

Finally, being this is an Albertan blog and all, I have to point out that it's different here. Note the higher proportion of younger people and mini baby-boom.


Thursday, November 11, 2010

A look across Canada

This post will look at that price range in some of different markets (Edmonton, Calgary, Vancouver and Toronto). The properties picked have the following criteria:

  • Asking price around $330,000
  • Detached single family home
  • Not an obvious teardown w/ indoor photos
  • Close to downtown

This was done to avoid comparing a bigger and newer house in a distance suburb of one city to a central teardown in another. Due to the "central single family" criteria these are small places with land being a significant portion of the price. Click on the image for the Google street view.

Edmonton

$324,900
1034sqft, 1950s bungalow
basement suite
3.7km from downtown


Country living in Westmount! 1035 sqft bungalow with double detached garage backing a park is ready for you to call home! 3 generous sized bedrooms up, and your master has a walk in closet, which is rare in a home of this age! Beautiful character has been preserved with coved ceilings, original hardwood floors throughout the main floor, and brand new lino in the kitchen. Downstairs is a fully developed in-law suite with two bedrooms, and a spacious open kitchen into the living area. Basement has a 4 piece bath, with shared laundry area, a furnace that's about 5 years old, and a newer hot water tank. The back yard is very private with large trees, and 6 ft privacy fence. Enjoy quiet fall evenings in the yard around the fire pit. Out your backyard is an off leash dog park to add to your private retreat in the city!

Calgary

$339,900
954 sqft house with finished basement
older house (1911)
3.1 km from downtown


Completely renovated home with a total of 3 bedrooms. Upper floor with huge living room with high ceilings and lots of character! Re done kitchen with stainless steel appliances. Good sized master bedroom and den or dining room. Basement is fully finished with 2 bedrooms, family room and completely renovated 4pc bathroom. Huge yard with single detached garage with electrical and gas hook ups. New furnace and hot water tank. ~Drive by ******* Ave NW~


"Vancouver"

$329,000
1415 sqft* no basement
Actually located in Surrey (24 km to downtown)


Over 1400 sqft. 3 bdrm rancher with loft on a big fully fenced 8000sqft lot. This home has had many upgrades: vinyl siding, newer roof, flooring, hot water tank, decking & more. Large South facing backyard. Close to all amenities, school, shopping, transportation. All measurements approx buyer to verify.

Toronto

$334,900
9.2km from downtown


** Well Maintained 2-Bedroom Bungalow In Demand Location ** Hardwood And Ceramic Floors ** Home Rewired 2009 ** 100 Amp Breakers ** New Cac And Furnace 2009 ** Some New Windows ** New Front Door**Updated Roof ** Wrought Iron Fence At Front ** Updated Bath ** Well Kept Home! ****** EXTRAS **** ** Fridge ** Stove ** New Washer ** New Dryer ** Microwave ** All Window Coverings ** All Light Fixtures ** New Furance And Cac **

Saturday, November 6, 2010

Garth on Jobs

But, this just states the obvious. The latest job numbers are terrible (3,000 new positions in the entire country, and a whack of those are ‘self-employment’).
Nov 5, 2010

Note that he omitted the gain of 47,000 full-time jobs offset by a loss of 44,000 part-time ones. Also he references that self employment makes up these new positions contrary to the report indicating 24,000 fewer self-employed positions.

While in this report Garth focuses on the headline number, in other cases he has selected different components which implying a deteriorating job market. However over this time period all of these components have been trending positive.


And today's jobs report shows the economy's still a dangerous thing, especially in Ontario. But, whadda I know?
July 9 , 2009


Hard to see how all this can happen when in a single month 53,000 people stopped looking for jobs, 45,000 more lost their jobs, and 35,000 made up jobs. Yet even with the official job loss number of just 45,000, we were in economic free fall compared to the States.
Aug 9, 2009


Last month Canadian employers terminated 139,000 full-time jobs, and created 130,000 part-time positions. So, those gains everybody was crowing about some weeks ago are pretty much gone, at least for now. And losing 139,000 steady jobs is a big deal – equivalent to the US shedding 1.3 million in a month, which would be a national disaster. Thank goodness some temporary or reduced-hours work was created.

Aug 8, 2010


A more serious analysis would consider all the different factors - not only the ones that portray a negative environment. Another thing to be cautious of in this report is monthly spikes that do not reflect underlying trends.


There has been a legitimate job recovery in Canada since July 2009, although it has not been robust enough to bring the unemployment rate to pre-recession levels. Total employment has fully recovered and wages have increased. The problem is this has been largely offset by a growing labour force.

Thursday, November 4, 2010

Edmonton New Construction Sept 2010

The number of single family homes under construction in Edmonton has leveled off after over a year of increasing steadily. In April 2009 there were only 1,764 homes were under construction, this increased to 4,116 this July and as of September was 4,078.


When factoring in all types of construction it is clear that single family homes have been more popular recently. The glut of completed and unabsorbed condos* remains high but is down somewhat year over year from 1,224 to 946. *Actually dark grey in the chart below is everything except single family homes, which are mostly condos

link

Tuesday, November 2, 2010

Edmonton Market Update

The REALTORS Association of Edmonton posted stats for October today.


Housing sales fell as expected in October. Right now the rate of sales is very slightly above the scorched earth benchmark, a rate equivalent to the worst six months of the financial crisis.


New listings fell faster than normal in October. They are slightly below an equivalent rate of the 2nd half of 2009, which was fairly low.


The sales to new listing ratio is 54% seasonally adjusted.


The last chart is a look at sales, new listings and inventory over the last few years. Another thing to note is that single family homes recorded their first year over year price drop since August 2009.

Here a few things to watch out for soon:
  • U.S. Midterm election results (tonight and tomorrow)
  • Quantitative Easing Round 2 (tomorrow)
  • Labour force survey (Friday)

Monday, November 1, 2010

Calgary Market Update

"Old Criteria" numbers have been posted by Bob Truman today for Calgary.


Sales fell as expected this month. They have maintained a level slightly above scorched earth after rebounding this summer. Sales are still pretty bad, but they could be (and have been) worse.


Listings dropped slightly faster than what would be expected and are now below the seasonally adjusted constant rate of the 2nd half of 2009.


Seasonally adjusted sales are at fairly low levels but have broke through the six month moving average on the upside. I am not a fan of technical indicators so all this tells me is that so far the sales slowdown has been slightly less brutal than during the worst six months of the financial crisis.


New listings are down considerably after spiking earlier this year.


The seasonally adjusted sales to new listing ratio broke 50% in October. While a 50% indicator has been shown to be the transition point between falling and rising prices I should add a few points of caution to this.

1. Prices have seemed to lag this indicator somewhat with rising prices earlier this year even with a sub 50% ratio. So some amount of price declines are probably still baked in.

2. This improvement has been more due to the drop of new listings as sales have remained fairly weak. Some are skeptical of using new listings as a market indicator. The main criticism (I think) is that the number includes original listings and re-listings so its hard to judge how much new supply is added. I think if someone re-lists it measures difficulty and/or motivation to sell and an original listing measures new supply. Either way the higher the number the weaker the market will be assuming a constant sales rate.

3. Even if the ratio was an accurate gauge of where prices were will go this is one month of 50%. So unless there is further improvement this only indicates potential stability.


And finally a look at sales, new listings and inventory over the years.

Saturday, October 30, 2010

Perspective


  • In-migration increases labour supply and lowers wages
  • Out migration reduces housing demand
  • Inflation forces consumers to spend more money on necessities
  • Deflation increases real debt burdens
  • Higher rates are unaffordable
  • Lower rates are unsustainable
  • Higher housing starts will result in oversupply
  • Low housing starts will crush the economy
  • High consumer sentiment implies mass delusion
  • Low consumer sentiment implies a weak economy
  • High inventory results in plenty of choice
  • Low inventory results in higher prices
  • Inflation increases the price of tangible assets
  • Deflation leads to lower rates
  • Higher rates reflect an improved economy
  • Lower rates improve affordability
  • Higher housing starts contributes to economic growth
  • Low housing starts leads to shortages
  • Higher prices reflect strong demand
  • Lower prices result in buying opportunities
Updates: See transcript of Don Campbell's recent interview at VREAA. One way to be disingenuous is to look at the facts and pick one of the arguments above in a knee jerk fashion to support your own perspective. Don Campbell does one better by using the one way price model - Where supportive data justifies increasing prices and negative data will only lead to a "plateau".

Radley pointed out that average weekly earning increased by over 7% in Alberta. That's huge. The monthly number tends to fluctuate so this is probably overstated. Year to date average weekly earnings are up 4%. link

Saturday, October 23, 2010

Lenders Behaving Badly

Something to consider about fixed rate loans. Penalties.

The fact they exist isn't what is troubling. It is a problem when the penalty is arbitrary and unnecessarily complicated. The Globe and Mail discusses how lenders select an unrelated interest rate (the posted rate) when doing interest rate differential calculations, which end up favoring the lender.

....

Here comes the evil part.

At many big banks, they don’t use your existing 4.75-per-cent rate. What they do is take the posted rate at the time you took out your mortgage. This is a rate that has no relevance to you, as you never paid it. In fact, it likely isn’t listed anywhere on your mortgage contract. Remember the ridiculously high mortgage rate we talked about at the beginning of this article? Now you see what it can be used for.

....

Because of this sleight of hand, you would now owe the bank an additional $12,000!
The federal government was going to announce some regulation regarding mortgage penalties but has failed to do so. Reducing onerous mortgage penalties will reduce future foreclosures at the margin, which in addition to consumer protection should be the goal of regulation - not controlling asset prices.

The Canadian Mortgage Trends blog recently wrote about some lesser know potential costs of borrowing. I don't have comment for each individual item, but when compiled into a list it seems the industry benefits themselves through technicalities and obfuscation.
  • Restrictions on breaking your mortgage before the term is up
  • Restrictions on breaking your mortgage for the first 3 years
  • A penalty surcharge of 1% for mortgages broken within the first 12 or 36 months
  • “Reinvestment fees” (on top of mortgage penalties)
  • Interest rate differential (IRD) penalties based on an onerous bond yield calculation
  • IRD penalties on variable-rate mortgages (usually IRD penalties apply to fixed mortgages)
  • IRD penalties based on a costly posted vs. discounted rate formula
  • Inability to port unless the purchase and sale take place on the exact same day (which can be hard to arrange)
  • A poor conversion rate guarantee
  • No refinances during the first year
  • No free switches (for transfer-eligible mortgages)
  • Amortization limits of 25 years
  • Minimum amortizations of 15-18 years
  • Restrictions on converting from a variable rate to a fixed rate for the first six months
  • No ability to break your “open” HELOC without a penalty
  • No pre-payments within 30 days of discharge
  • Inability to port across provincial lines
  • High administrative fees when porting
  • 100% clawback of cash-back if the mortgage is broken before maturity
  • Requirement for a full banking relationship with the lender
  • No lump-sum pre-payment privileges
  • No annual payment increase allowance
  • Pre-payments restricted to one specific day a year (instead of any payment date)
A lot of the fees are related to breaking the mortgage, which can occur simply by selling the house. With this in mind some thing that can mitigate these risks.

  • Borrow below your limit which reduces the chance of a forced sale during financial stress.
  • Keep amortization periods as short as possible to avoid dealing with these fees for 25-40 years!
  • Only buy if you seriously plan to stay in the house for awhile (5+ years)
  • Avoid gimmick mortgages like the so-called "cash back"

Friday, October 8, 2010

Edmonton Market Update


Here are the charts once again. This time I'd like to know what the dozen or so readers out there have to say about them. One point - I estimated sales in some of these charts based on preliminary numbers.

Have a great weekend.