 Sales were little changed in November compared to the previous month where normally a drop would be expected.
After a spike earlier this year new listings have more closely tracked the rate equivalent to the 2nd half of 2009.
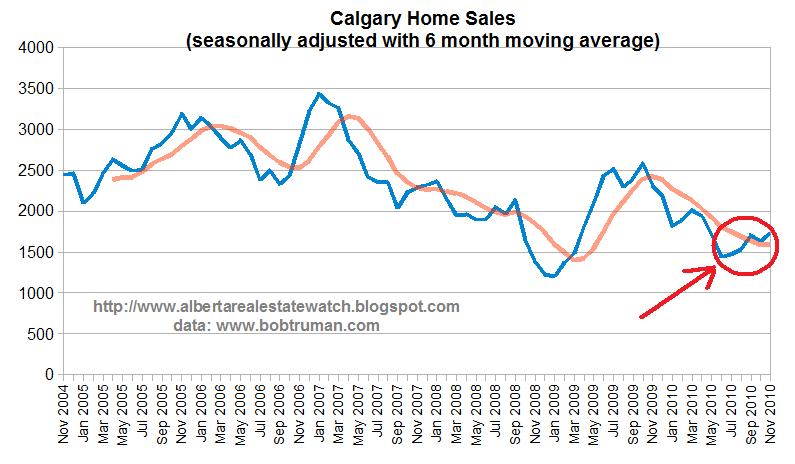 See the sales surge? Looking at a seasonally adjusted chart it's more like a modest bounce from depressed levels. Not a distressed market but not quite a robust one either.
Seasonally adjusted new listings have been holding roughly the same level as the 2nd half of 2009.

The sales to new listing ratio is stuck around 50%. This has improved from earlier this year due to lower listings and a higher seasonally adjusted sales rate.

The last chart shows sales, new listings and inventory over the last 5 years.
Raw data from Bob Truman's site
Explanation of benchmarks
No comments:
Post a Comment