Saturday, March 26, 2011

Don Campbell - Analyzing the sales pitch (II)

The last post covered the theme of Don Campbell's recent blog to sell seats at a weekend real estate course. He just had to inform Albertans of a pre-boom buying window before outsiders bought everything up first. The wording was selected carefully to only imply massive price appreciation while being open to interpretation to avoid future scrutiny. He reassured skeptics they could dramatically reduce risk by investing not speculating while still using upcoming price appreciation as a central incentive.

The argument for a return to higher prices was made with the 'Momentum Graph' shown below [emphasis mine].
Here's what you use to predict the real estate market future: The Momentum Graph, which shows exactly the progression of an economy and how it eventually impacts the Real Estate Market.


The Economic Formula to Predict The Future

In a nutshell this graph states the following:

GDP growth >> Job growth >> Population growth >> Increased rental demand (12 months later) >> Increased rents >> Property purchase demand (18 months later) >> and eventually leads to property price increases.

This chart was constructed to be used conveniently with the GDP data from royal bank presented later. Putting the two together the reader can predict exactly the amount of future price increases higher prices (edit). Note how it is referred to as a "formula" to give the false impression it is based on some serious scientific theory.

The Momentum Graph falsely claimed to show "exactly the progression of an economy and how it eventually impacts the Real Estate Market". I will provide some specific examples that contradicts this:


Radley showed that the 2006-2007 price appreciation went over and above any GDP growth here.


Ben at Financial Insights recently compiled a similar chart for the Canadian wide market.


The Edmonton Housing Bust Blog compared local condo prices to rents. In Don's momentum chart it shows that rent increases come first and then lead to higher prices. If this was applicable to the last boom this ratio should have fallen with higher rents initially then increase as prices caught up. Instead prices outpaced rents for the entire boom.


Now consider the Teranet Price Index at 3 points in time after the boom.

1) In mid-2007 there was positive GDP growth, a strong job market, population growth and rent increases. The 'Momentum Graph' would predict future price increases yet they were at their absolute peak.

2) In spring of 2009 GDP was lower after the oil bust and recession, combined with lower population growth and increasing Alberta unemployment. The 'Momentum Graph' doesn't go into reverse for obvious reasons, but if it did it sure wouldn't predict a bounce in prices.

3) In mid 2010 the Alberta economy and job growth have improved yet prices started trending down despite this.

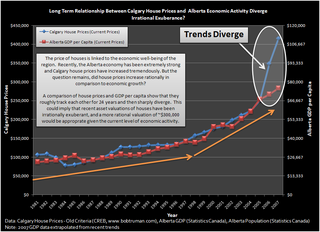
Even if you accept some relation between GDP and house prices it is reckless not to mention that 2006-2007 was an anomaly. Don wants readers to make the connection with the GDP chart and another boom to pump his seminar, while being vague enough to provide future cover. Adding context is not helpful to his financial goals.

Sunday, March 20, 2011

Don Campbell - Analyzing the sales pitch

Don Campbell wrote a blog entry last week where he makes the case to sign-up for his training seminars to take advantage of real estate momentum. Read the entire pitch here.
I would love to see you and your guests there – so you discover how long-term sustainable wealth was created in the last two economic jumps and how you can do it this time, while still dramatically reducing risks, and by investing, not speculating. You have an economic dream for yourself and your family – our job is to support you in creating it.
He distances himself from risky speculation but repeatedly implies price appreciation to help sell $587 seats to his training session.

Look at the carefully chosen wording. The phrase 'last two economic jumps' refers to how real estate appreciated during the 90s after the oil bust and the massive price hikes of the boom more recently. Then he writes you can take advantage 'this time' inferring that an 'economic jump' is happening now. Now one could say the phrase 'economic jump' is open to interpretation but I read it as a euphemism for sudden price increases. Consider the blog title.
During The 2007 Boom Days, Investors ASKED For Another Pre-boom Buying Window…

Is It Here, Or Not?
'Pre-boom buying window' means a limited period of time to act before a rapid run-up in prices. In other words enroll in the class and make boatloads of money. It's not speculating however...
This is not speculating – this is true investing. Doors like this open every so often, your job is to step through them.
See the mix of enticing readers through implying a limited opportunity of price appreciation but reassuring them that they can learn how take advantage of the situation in a less risky way by 'investing'.

There is a frantic energy here where Don just happens to stumble upon this information and he just has to share it with Albertans first.
This weekend changed me, it changed me because of the research I was doing, it changed me to the point that I had to write this unscheduled post.
...
In other words, those outside the province ate many an Albertan's cash-flow lunch. It was only after the momentum was at full speed that many did awaken to try and get into the market.
...
Those outside the province are already seeing it, and are jumping in with both feet (just like the last two times). My wish is that Albertans aren't the last to see it again.
...
Yet, those outside Alberta swooped in and got in front and the markets took off.

See the way the story is told here. He's rushing to tell you this information first before outsiders storm in and take the opportunity away. In other words act now. This is very similar to what he had to say in March 2008. link.
International investors are definitely buying. Calgary and Edmonton real estate is hot in Europe and the U.S., more than I've ever seen before in all my years involved in real estate. The top banks in Ireland, for instance, are buying here. They see it as safe, secure and good for the long-term, compared to other options.
He also loosely ties disjoint economic situations and world events to the argument generating a level of reader confusion and anxiety which to capitalize on.
So let me get to the point… as of this weekend I have not seen the Alberta economic fundamentals pointing to this strong of long term momentum in all the years I have been studying them. And this factors into the turmoil that is occurring around the world, the strong Canadian dollar, the huge debt being created in the US, and the potential for a longer term world economic doldrum.
Finally, consider the more concise deconstruction of Don's post by Calgary Realtor Mike Fotiou.

What annoys me with these pitches is:

-the blatant pandering and ego stroking. Those that listen and act on his advice are “savvy” and “sophisticated” investors.
-Limited time. Get in now.
-fear of missing out, appeal to greed “We all remember how things were going in Alberta for the years 2006- 2008″
-feigning objectivity. “I have nothing to gain from this” (except the hundreds of dollars in course and membership dues)

Exactly.

Saturday, March 12, 2011

Edmonton Stats Feb 2011

Edmonton sales are now only slightly higher compared to the rate equivalent to the worst six months of the financial crisis.


Seasonally adjusted sales to new listings ratio fell below 50% again indicating downward pressure on prices.

Calgary Stats Feb 2011

After a slow start in January sales have picked up in February. Even with this increase they are still below the pace set in the 2nd half of 2009 shown in green in the chart below. It will be interesting to see how much the new mortgage rules will slow sales after March 17. I believe the impact of this change has been overstated because it is a marginal reduction of the size of a mortgage allowed and only effects those who were going to their affordability limit with the maximum amortization. (It is a positive change long term and if you are a buyer rushing to get a 35 year am - don't do it. Get a shorter amortization later when you can afford it.)


New listing have ramped up at the start of 2011. This stat will be important to watch over the next few months. Will we have a higher than normal surge this spring similar to last year?


Seasonally adjusted sales have remain higher compared to late last spring but nowhere near the pace of the boom of 2006-2007.


Seasonally adjusted new listings have increased consistently since reaching a low in October 2010.


So far in 2011 the sales to new listings ration has dropped below 50% due to new listings rising more than sales on a seasonally adjusted basis.

Since December the median price (Old Criteria) has increased from $342,500 to $357,250. I believe that sales mix and seasonal factors contribute to this so to give further insight I hope to add seasonally adjusted price charts shortly. The same goes for total inventory as well which has increased from 6,056 to 7,517.