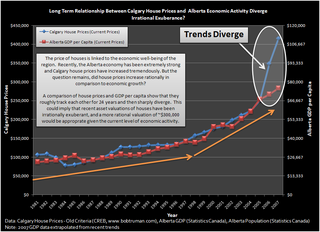
The argument for a return to higher prices was made with the 'Momentum Graph' shown below [emphasis mine].
Here's what you use to predict the real estate market future: The Momentum Graph, which shows exactly the progression of an economy and how it eventually impacts the Real Estate Market.This chart was constructed to be used conveniently with the GDP data from royal bank presented later. Putting the two together the reader can predict
The Economic Formula to Predict The Future
In a nutshell this graph states the following:
GDP growth >> Job growth >> Population growth >> Increased rental demand (12 months later) >> Increased rents >> Property purchase demand (18 months later) >> and eventually leads to property price increases.

The Momentum Graph falsely claimed to show "exactly the progression of an economy and how it eventually impacts the Real Estate Market". I will provide some specific examples that contradicts this:
Radley showed that the 2006-2007 price appreciation went over and above any GDP growth here.

Ben at Financial Insights recently compiled a similar chart for the Canadian wide market.

The Edmonton Housing Bust Blog compared local condo prices to rents. In Don's momentum chart it shows that rent increases come first and then lead to higher prices. If this was applicable to the last boom this ratio should have fallen with higher rents initially then increase as prices caught up. Instead prices outpaced rents for the entire boom.

Now consider the Teranet Price Index at 3 points in time after the boom.
1) In mid-2007 there was positive GDP growth, a strong job market, population growth and rent increases. The 'Momentum Graph' would predict future price increases yet they were at their absolute peak.
2) In spring of 2009 GDP was lower after the oil bust and recession, combined with lower population growth and increasing Alberta unemployment. The 'Momentum Graph' doesn't go into reverse for obvious reasons, but if it did it sure wouldn't predict a bounce in prices.
3) In mid 2010 the Alberta economy and job growth have improved yet prices started trending down despite this.
Even if you accept some relation between GDP and house prices it is reckless not to mention that 2006-2007 was an anomaly. Don wants readers to make the connection with the GDP chart and another boom to pump his seminar, while being vague enough to provide future cover. Adding context is not helpful to his financial goals.
3 comments:
Three quick thoughts: First, I don't think Don's trying to say that the progression they indicate on that illustration is able to "predict exactly the amount of future price increase".
Second, price appreciation is the least of the three ways to make money with investment real estate (the others being mortgage pay-down and positive cash-flow). That's clear from the first few points on the graph (increased rental demand and decreased vacancies).
Third, if you're going to have a serious conversation about real estate, economic growth and investment, you've gotta look more than 5 years in either direction. The economic developments taking place now have measurable impacts 20 years in the future, and we're also looking back to similar situations as far back as the 1970's. Now is more comparable to 2001 than 2005 or later.
I'm not a member of REIN and don't agree with it's business model, but REIN actually works for some. Just like everything else in life if you rely on just one source, you get what you get. Which most of the time is not good.
I do agree with REIN and what Chris just posted though. Price in Alberta will not be going down much and most likely be going up due to the economic climate. The just won]t be going up at the same pace they did during the in-migration boom we had from mid-2005 to early 2007. And yes the majority of the price increase was caused by in-migration, not low interest rates, cheap available credit or Government policy. If that was the case other Canadian cities would have seen similar price appreciation graphs like Alberta, but they didn't. The saw appreciation, but not the same extent as Alberta.
Chris,
1) Good point. I updated the post.
2) The chart doesn't say anything about positive cash flow or mortgage pay down but instead leads to price increases. There is mention of cash flow later on in the context of outsiders investors buying those properties before Albertans can.
3) Don's post sounds urgent and implies we are in a pre-boom buying window. He writes that outsiders are 'jumping in with both feet' and that last time this happened the 'markets took off'. Personally, I don't think this refers to 20 years into the future.
Post a Comment