First off why was the title of the article changed from boom to bust to boom to buyer's market? (Just speculating) So here we have yet another call for decreasing inventory, granted this is probably getting more and more likely as time goes on.Q: Should I buy now or wait?
Perras: "I think it's a great time to buy now. If we're going to see any softening in prices, it's going to be in the second quarter, which is right now. This kind of inventory is going to thin out as we get into the fall."
More importantly, I am not sure where the idea that the price correction is limited to Q2 came from. Last year prices and inventory fell in the fourth quarter.
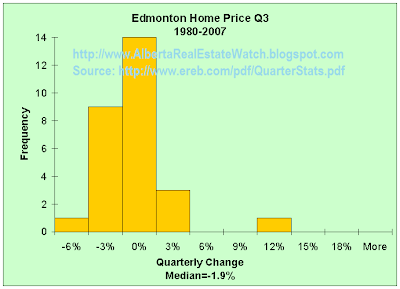
Below I determined the frequency of varying rates of appreciation over each quarter going back to 1980. Quarterly appreciation was determined by calculating the difference of the average residential price from the last month of the quarter compared to the last month of the previous quarter.
For example take Q2 2006
June 2006: $254,240
March 2006: $220,124
change: 15.5%
So this is put in the Q2 chart below at 18%, representing the frequency of quarterly appreciation above 15% up to 18%. A histogram.


Source
Note that going back price weakness generally occurs in Q3 and to a lesser extent in Q4. In fact for Q3 there has been only 4 instances of positive quarterly price growth. While Q2 is the opposite with only 3 price decreases.
After this I wonder if the argument presented in the article is a genuine conclusion based on some sort of analysis? Or was it conjured out of nothingness to promote sales?
1 comment:
Conjured out of sheer ingnorance, hopeful the general public is as stupid and will fall for the propaganda, as many of their own did by buying at the peak in '07.
-
Post a Comment